
Timisoara_Med 2024, 2023(2), 3; doi:10.35995/tmj20230203
Article
Solid-State Characterization of Mupirocin and Metronidazole
Amalia Ridichie 1,
Adriana Ledeți 1,* ,
Denisa Ivan 1,
Carmen Tomoroga 1,
Laura Sbârcea 1,
Lenuța-Maria Șuta 1,
Răzvan Bertici 1,2,
Anca Dragomirescu 1,
Florentin Crăineanu 2
and
Ionuț Ledeți 1
,
Denisa Ivan 1,
Carmen Tomoroga 1,
Laura Sbârcea 1,
Lenuța-Maria Șuta 1,
Răzvan Bertici 1,2,
Anca Dragomirescu 1,
Florentin Crăineanu 2
and
Ionuț Ledeți 1
,
Denisa Ivan 1,
Carmen Tomoroga 1,
Laura Sbârcea 1,
Lenuța-Maria Șuta 1,
Răzvan Bertici 1,2,
Anca Dragomirescu 1,
Florentin Crăineanu 2
and
Ionuț Ledeți 1
1
Advanced Instrumental Screening Center, Faculty of Pharmacy, Victor Babes University of Medicine and Pharmacy, 300041 Timisoara, Romania; amalia.ridichie@umft.ro (A.R.); circioban.denisa@umft.ro (D.I.); axente.carmen@umft.ro (C.T.); sbarcea.laura@umft.ro (L.S.); suta.lenuta@umft.ro (L.-M.Ș.); razvan.bertici@yahoo.com (R.B.); dragomirescu.anca@umft.ro (A.D.); ionut.ledeti@umft.ro (I.L.)
2
Faculty of Medicine, Victor Babes University of Medicine and Pharmacy, 300041 Timisoara, Romania; florentincraineanu@gmail.com
*
Correspondence: afulias@umft.ro; Tel.: +40-724-084-531
How to cite: Ridichie, A.; Ledeți, A.; Ivan, D.; Tomoroga, C.; Sbârcea, L.; Șuta, L.M.; Bertici, R.; Dragomirescu, A.; Crăineanu, F.; Ledeți, I. Solid-state Characterization of Mupirocin and Metronidazole. Timisoara Med. 2023, 2023 (Issue 2), 3; doi:10.35995/tmj20230203.
Received: 6 December 2023 / Accepted: 26 December 2023 / Published: 17 January 2024
Abstract
:Mupirocin is a topical antibiotic widely used to treat various skin infections caused by Gram-positive and Gram-negative bacteria, being the first-line treatment in the case of an infection with methicillin-resistant Staphylococcus aureus (MRSA). Due to the unique mechanism of action, it does not possess any cross-resistance with other antibiotics, leading to its global use in different hospital departments. The main disadvantage of mupirocin is represented by its pharmacokinetic properties, leading to the main purpose of this study, namely, to fully characterize the physicochemical properties of the active pharmaceutical ingredient. Currently, it is used in different combinations with other active substances, for example metronidazole, to decrease the risk of developing resistance to mupirocin and to improve the therapeutic response. This leads to the second purpose of this study, i.e., to characterize the physico-chemical profile of metronidazole and to find out if there are any chemical interactions between the two compounds, and to establish if there is a possibility of using them in the same pharmaceutical formulation, thus increasing the compliance of the patient to the treatment.
Keywords:
mupirocin; metronidazole; thermal analysis; kinetic analysisIntroduction
Mupirocin, or pseudomonic acid A, is a natural antibiotic produced by the bacterium Pseudomonas fluorescens, first described as pseudomonic acid in 1971 by the Ernst Chain laboratory research team. Later, in 1978, it was discovered that this bacterium produces a mixture of pseudomonic acids, namely A, B, C and D, with their structures presented in Figure 1(I). The major component of the mixture of secondary metabolites is represented by pseudomonic acid A. Mupirocin can also be synthesized by other Pseudomonas species, but with a much-reduced efficiency compared to the fluorescens species. Pseudomonic acid derivatives have also been identified within the genus Alteromonas sp. [1,2,3,4]. From a structural point of view, mupirocin is an ester of monic acid, the esterification being carried out with a saturated fatty acid, namely 9-hydroxynonanoic acid. The chemical stability of the epoxy group in position 10–11 is in the acidic or weakly basic range, 4 ≤ pH ≤ 9. At another pH value, the irreversible interaction of the hydroxyl group from position 7 with the epoxy group from position 10–11 occurs, forming two cyclic ethers (Figure 1(II,III)) [1,5,6].
Figure 1.
The chemical structures of (I). mupirocin (namely Pseudomonic acid A); (II) and (III) the two formed cyclic ethers from mupirocin formed outside the stability pH domain.
Figure 1.
The chemical structures of (I). mupirocin (namely Pseudomonic acid A); (II) and (III) the two formed cyclic ethers from mupirocin formed outside the stability pH domain.

Mupirocin is one of the topical antibiotics widely used to treat various skin infections caused by Gram-positive and Gram-negative bacteria, being the first-line treatment in the case of an infection with methicillin-resistant Staphylococcus aureus (MRSA), and among the pathogens for which the discovery of new therapeutic alternatives is urgent, as stated by the WHO [7]. In addition to drug therapy, several natural extracts and essential oils, obtained from Myristica fragrans Houtt., Piper cubeba L., Melaleuca alternifolia, Eucalyptus globulus Labill., Thymys zygis L., Lavandula augustifolia Mill., Stachys viticina Boiss., Nectandra megapotamica, Aloysia citriodora Palau, and Nigella sativa L., have been presented in the scientific literature as being effective against MRSA [8].
Mupirocin is currently available on the pharmaceutical market in the form of a cream or ointment (Bactroban, Bactoderm, Mupirocin, Turixin) in a concentration of 2%. Due to the unique mechanism of action, it does not possess any cross-resistance with other antibiotics, leading to its global use in different hospital departments. However, the therapeutic efficacy of mupirocin is diminished by its pharmacokinetic properties, such as a short half-life (<30 min) and a high plasma protein binding. Thus, to improve these pharmacokinetic aspects, it is necessary to study the physical–chemical properties of the active substance [5,9,10,11,12]. The antibacterial activity of mupirocin depends on the value of the pH, and thus it is greater in an acidic medium, conferred by the pH value of the skin of approximately 5, making the active pharmaceutical ingredient a great candidate for skin infections caused by MRSA [9,13].
Currently, to decrease the risk of developing resistance to mupirocin and to improve the therapeutic response, various combinations of it with other active pharmaceutical ingredients are being studied: with antibacterial effects: chlorhexidine gluconate [14,15], povidone iodine [16], silver sulfadiazine [17] and metronidazole [18]; with anesthetic effect: lidocaine [19]; with antihistaminic effect: levocetirizine [20]; and with anti-inflammatory effect: triamcinolone acetonide [21], fluticasone propionate [20].
Metronidazole is a 5-nitroimidazole derivative (Figure 2) used in the treatment of infections with anaerobic germs (Clostridium sp., Eubacterium sp., Peptococcus sp., Peptostreptococcus sp., Bacteroides sp. (B. fragilis, B. distasonis, B. ovatus, B. thetaiotaomicron, B. vulgatus), Fusobacterium sp.), and is considered an essential medicine by the WHO. It was discovered in 1959 and used in the treatment of trichomoniasis, an infection of the genital tract caused by the parasite Trichomonas vaginalis [22,23].
Figure 2.
Chemical structure of metronidazole.

Considering the pharmacokinetic and pharmacodynamic properties of mupirocin, the purpose of this paper is to study the physicochemical properties of the active substance and the possibility of a chemical interaction with another molecule with an antimicrobial effect (metronidazole) to conclude if new pharmaceutical formulations containing both active molecules can be prepared. The experimental protocol was based on the implementation of a series of instrumental methods of analysis, more precisely Fourier transform infrared spectroscopy—FTIR, thermogravimetric analysis—TG and DTG, as well as the realization of a complex kinetic study based on three methods: ASTM E698, Friedman and Flynn–Wall–Ozawa.
Materials and Methods
Samples and Preparation
Mupirocin of >99.9% purity was received from TEVA (Lot: 80200102810) in powder form. This could be used without previously increasing the degree of purity of the active substance or without carrying out other steps prior to the experimental protocol and could be kept in the conditions recommended by the manufacturer.
Metronidazole of a purity above 99.9% was purchased from Fluka (Lot: #SLBG3633V) in crystalline form. The substance could be used without previously increasing the degree of purity of the active substance or without carrying out other steps prior to the experimental protocol and could be kept in the conditions recommended by the manufacturer.
To make the physical binary mixture, mupirocin and metronidazole were weighed, in a mass ratio of mupirocin/metronidazole = 2:1 (w:w). After trituration, a white powder was obtained which was sealed and kept in brown vials at 2–8 °C.
Fourier Transform Infrared Spectroscopy (FTIR)
Fourier transform infrared spectroscopy was applied to verify the identity and purity of the two active substances (mupirocin and metronidazole), as well as to establish the existence of any chemical interaction between the two compounds when kept at 2–8 °C. The device used for FTIR analysis was Jasco FT/IR—670 Plus. To obtain the spectrum, 16 successive recordings at 2 cm−1 were used. The spectral domain selected for the analysis was the range of 4000–400 cm−1.
Thermal Analysis
For the thermogravimetric analysis (TG/DTG) of mupirocin, metronidazole and the mixture, Setline TGA instrument was used, with a synthetic air flow rate of 46.67 mL·min−1. Samples weighed for analysis in alumina crucibles had a mass of approximately 6 mg. For heating, 4 different heating rates were selected (β = 2, 4, 6, 10 °C·min−1), with the starting temperature being the ambient one, and the maximum temperature being 600 °C.
Kinetic Analysis
The kinetic analysis was carried out on the data obtained from the thermal analysis at the four heating rates (β = 2, 4, 6, 10 °C·min–1). The apparent activation energy was initially calculated by using the ASTM E698 method, followed by the application of the two isoconversional methods: the Friedman differential isoconversional method (FR) and the Flynn–Wall–Ozawa (FWO) integral isoconversional method. To perform the kinetic analysis, version 4.46 of the AKTS—Thermokinetics Software was used.
Results and Discussion
FTIR Analysis
The results of the FTIR analysis led to the complete FTIR spectra of the analyzed samples being obtained, namely mupirocin (MUP), metronidazole (MTZ) and the binary mixture formed between the two active pharmaceutical ingredients (API) in a mass ratio of 2:1 (w:w). The wavenumbers observed on each spectrum of MUP and MTZ can be correlated with the functional groups and chemical bonds of the two APIs. In the case of the binary mixture, the purpose of the analysis was to observe whether there are any chemical interactions between the two compounds at ambient temperature, and the absence of the chemical interactions is rendered by the fact that the spectrum of the binary mixture should be the result of the superposition of the spectra of the two pure pharmaceutical substances [24]. The obtained results correspond to the data from the specialized literature, which demonstrates both the identity and the degree of analytical purity of the analyzed substances [25,26]. The results of the FTIR spectroscopy analysis are presented in Table 1 and in Figure 3, where the wavenumbers written in bold signify the differences observed on the spectra of the binary mixture when compared to the spectra of MUP and MTZ.

Table 1.
The wavenumbers of each absorption band observed on the spectra of MUP, MTZ and the binary mixture (MUP+MTZ).
Table 1.
The wavenumbers of each absorption band observed on the spectra of MUP, MTZ and the binary mixture (MUP+MTZ).
| Sample | ||||
|---|---|---|---|---|
| MUP | MTZ | MUP+MTZ | ||
| Spectral region | 4000–1600 cm−1 | 3478; 3309; 3241; 2998; 2972; 2935; 2922; 2908; 2894; 2867; 2849; 1774; 1728; 1719; 1712; 1676; 1657. | 3441; 3218; 3101; 3060; 3017; 2982; 2958; 2939; 2880; 2844; 1806. | 3478; 3310; 3224; 3101; 3061; 3017; 2998; 2982; 2972; 2935; 2922; 2908; 2892; 2867; 2849; 1806; 1775; 1728; 1719; 1712; 1657; 1652. |
| 1600–1000 cm−1 | 1469; 1450; 1438; 1420; 1401; 1382; 1362; 1348; 1334; 1319; 1305; 1288; 1254; 1233; 1223; 1170; 1163; 1145; 1105; 1089; 1076; 1046; 1025. | 1535; 1487; 1474; 1429; 1369; 1355; 1340; 1291; 1275; 1266; 1217; 1188; 1159; 1083; 1075; 1033. | 1535; 1487; 1474; 1450; 1432; 1401; 1369; 1355; 1341; 1305; 1289; 1275; 1266; 1254; 1233; 1223; 1188; 1160; 1105; 1084; 1075; 1047; 1025. | |
| 1000–600 cm−1 | 983; 964; 953; 941; 924; 892; 885; 861; 840; 824; 806; 789; 770; 757; 730; 669; 652; 622; 605. | 990; 970; 950; 907; 864; 826; 776; 744; 717; 679; 647; 607. | 984; 970; 950; 941; 923; 907; 892; 864; 840; 826; 806; 789; 769; 757; 744; 729; 679; 669; 647; 622; 607. | |
Figure 3.
The obtained spectra for MUP, MTZ and the binary mixture (MUP+MTZ).

On the FTIR spectrum of mupirocin at the following wavenumbers, 2972 and 2867 cm−1, can be observed the absorption bands characteristic of the stretching vibrations of the methyl radicals. The symmetrical bending vibrations of the same radical are observed at 1381 cm−1, and at 1463 cm−1 can be noticed in the asymmetrical ones. The symmetrical and asymmetrical stretching vibrations of the methylene radicals are highlighted at the wavenumbers 2935, 2921, 2907 and 2849 cm−1. For the stretching vibrations of the methylene radicals from the tetrahydropyran cycle, an absorption band at 2998 cm−1 is observed, and the methylidyne group determines an absorption band at 2894 cm−1. The stretching vibrations of the C=C moiety determine an absorption band at 1657 cm−1. The stretching vibrations of the hydroxyl radical are noticed as a broad absorption band with two peaks at 3478 and 3309 cm−1. The carbonyl moiety from the carboxyl (being unconjugated) and the ester (being conjugated) group determines an intense absorption band in the spectral region of 1766–1674 cm−1, with three maxima at 1728, 1719 and 1712 cm−1. At wavenumbers equal to 1101 and 1025, the C-O-C moiety from the tetrahydropyran ring and the epoxide radical can be observed. In addition, the C-O bonds determine two intense absorption bands, each presenting two maxima, the first one at 1233 and 1223 cm−1 and the second one at 1170 and 1163 cm−1.
The spectra of metronidazole revealed a large absorption band for the hydroxyl radical, described by two peaks, the first one at 3441 cm−1, characteristic of the dimeric form of the hydroxyl radical, and the second one at 3218 cm−1, describing the monomeric form of the same group. In the spectral region of 2995–2762 cm−1, the symmetric and asymmetric stretching vibrations of the C–H moiety from the methyl, methylene and methylidyne can be observed, the peaks being 2982, 2958, 2939, 2880 and 2844 cm−1. The imidazole ring determines an intense and sharp absorption band at 3101 cm−1, and the presence of the alkene moiety is confirmed by the absorption band at 1535 cm−1. Since metronidazole possesses tertiary amines groups, on the spectrum significant absorption bands cannot be observed, due to the lack of N-H moieties. The stretching vibrations of the bond between C-N are noticed at ν = 1188 cm−1 and ν = 1159 cm−1. The nitro radical determines several absorption bands, especially in the fingerprint region, with the first one presenting three peaks at 1487, 1474 and 1429 cm−1 (resulting from the asymmetric stretching vibrations), and the second one also having three maxima at 1369, 1355 and 1342 cm−1 (caused by the symmetrical stretching vibrations).
By studying the spectrum of the binary mixture, there are no significant differences when compared to the spectra of the pure APIs. The shoulder observed at 3241 cm−1 is not absent, it is just hindered by the absorption band of the hydroxyl radical from metronidazole. The same aspect can be noticed for the peak at 3441, characteristic of the dimeric form of the hydroxyl group of metronidazole. In addition, in the case of metronidazole, the absorption band at ν = 3218 cm−1 is shifted to a higher wavenumber, namely ν = 3224 cm−1. The other absorption bands characteristic of MUP and MTZ can be found on the spectrum of the binary mixture, suggesting the lack of a chemical interaction between MUP and MTZ at ambient temperature.
Thermal Analysis
The TG and DTG curves were recorded at four different heating rates, namely β = 2, 4, 6 and 10 °C·min−1, for MUP, MTZ and for the binary mixture between the two active pharmaceutical ingredients only for β = 10 °C·min−1. The results of the thermal analysis show the thermal stability of the APIs, essential factors in the preformulation state of new pharmaceutical forms, and by studying the DTG and TG curve of the binary mixture the presence or absence of chemical interactions when the mixture is heated can be observed. In order to conclude that a chemical interaction takes place between the two compounds of the mixture on the thermal curves, new decomposition processes or the disappearance of some decomposition processes of the pure substances should be observed, in addition to the differences that can be seen in the loss of mass for each decomposition process [24]. In Figure 4 and Table 2, the results of the thermal analysis are presented.
Figure 4.
The TG and DTG curves recorded at β = 10 °C·min−1 for A. MUP, B. MTZ and C. MUP+MTZ.

Table 2.
The results of the thermal analysis obtained for the analyzed samples, namely MUP, MTZ and the binary mixture (MUP+MTZ).
Table 2.
The results of the thermal analysis obtained for the analyzed samples, namely MUP, MTZ and the binary mixture (MUP+MTZ).
| Sample | β (°C·min−1) | Decomposition Step | Ti (°C) | Tmax DTG (°C) | Δm (%) |
|---|---|---|---|---|---|
| MUP | 2 | I | 148 | 298 | 31.9 |
| II | 327 | 330 | 14.6 | ||
| III | 360 | 393 | 26.7 | ||
| IV | 424 | 473 | 27.0 | ||
| 4 | I | 164 | 327 | 51.5 | |
| II | 368 | 375; 392; 413 | 25.0 | ||
| III | 443 | 496 | 23.5 | ||
| 6 | I | 169 | 336; 365 | 54.3 | |
| II | 377 | 402; 411 | 19.9 | ||
| III | 445 | 503 | 23.8 | ||
| 10 | I | 173 | 366 | 65.2 | |
| II | 395 | 399 | 3.73 | ||
| III | 406 | 413 | 12.0 | ||
| IV | 458 | 533 | 18.8 | ||
| MTZ | 2 | I | 135 | 236 | 98.6 |
| 4 | I | 136 | 245 | 99.1 | |
| 6 | I | 141 | 258 | 94.7 | |
| 10 | I | 143 | 277 | 92.2 | |
| MUP+MTZ | 10 | I | 130 | 261 | 32.0 |
| II | 298 | 346; 386 | 38.5 | ||
| III | 401 | 414 | 9.1 | ||
| IV | 468 | 540 | 18.4 |
The analysis of TG curves of mupirocin reveals a thermal stability up to 148 °C. The most detailed decomposition process of mupirocin is highlighted on the TG and DTG curves obtained after a heating rate of β = 2 °C·min−1, where four decomposition stages can be observed. Thus, the first decomposition process noticed on the DTG curve takes place in the thermal range of 148–298 °C, with a mass loss of approximately 32%, followed by the second one, with a mass loss of Δm = 14.6%. For the third and fourth decomposition processes, the mass loss is almost equal, namely 27%.
In the case of metronidazole, all the TG and DTG curves revealed a one-step decomposition process and a thermal stability for the active pharmaceutical ingredient up to 135 °C. The mass loss for the decomposition process is about 96%.
By studying the TG and DTG curves for the binary mixture, the decomposition process begins at 130 °C. The relatively low thermal stability of the mixture is determined by the presence of metronidazole. The degradation of the mixture takes place in four steps. The first one consists of the degradation of metronidazole, a fact rendered by the mass loss. Due to the ratio of mupirocin/metronidazole 2:1 (w:w) in the binary mixture, for each decomposition step observed for the pure substance on the thermogravimetric curves of the mixture, a loss of mass of 2/3 in the case of mupirocin and 1/3 in the case of metronidazole should be observed when compared to the loss of mass of the pure compounds. For the first process observed for the mixture, the expected Δm is 30.7% and the data shows a loss of 32%, with the slight difference caused by the immediate start of the second decomposition process characteristic of the first decomposition process observed on the thermoanalytical curves registered at β = 10 °C·min−1 for mupirocin. Also, for this process, the loss of mass is slightly lower than that one expected, confirming that the degradation of mupirocin begins during the first step. The second degradation process for the mixture can be associated with the first decomposition process, and the beginning of the second process of the degradation of mupirocin. Also, for this process a shift can be observed in the maximum of the DTG curve for each decomposition process, suggesting the presence of a chemical interaction between the two APIs. The third decomposition step can be correlated with the continuance of the second decomposition step and the third degradation process of mupirocin. For these two processes, the maximum noticed on the DTG curve corresponds with that observed for the pure substance. Those results suggest that, when the mixture is heated, there is a chemical interaction between mupirocin and metronidazole.
Kinetic Analysis
In order to perform the kinetic analysis, the data from the first decomposition process observed on the DTG curves recorded at β = 2, 4, 6 and 10 °C·min−1 for MUP and MTZ were used. In Table 3, the selected temperature range can be observed.
Table 3.
The selected temperature range for the first decomposition process observed on the DTG curve for MUP and MTZ at four heating rates.
Table 3.
The selected temperature range for the first decomposition process observed on the DTG curve for MUP and MTZ at four heating rates.
| β (°C min−1) | DTG Temperature Range for the Selected Decomposition Process (°C) for Kinetic Analysis | |
|---|---|---|
| MUP | MTZ | |
| 2 | 160–325 | 135–244 |
| 4 | 165–365 | 140–260 |
| 6 | 170–379 | 143–280 |
| 10 | 195–407 | 147–299 |
The first step to perform the kinetic analysis was to generate the reaction progress vs. temperature (Figure 5) and the reaction rate vs. temperature (Figure 6) by using the data presented in Table 3. In all figures a shift can be observed to a higher temperature in the selected process, which is caused by the increasing of the heating rate, agreeing with the fact that mass/heat transfer is influenced by a higher inertia when the heating rate is increased. In the case of metronidazole, it can be observed that the decomposition mechanism does not change along with the increase in β. For mupirocin, it can be noticed that for each heating rate the decomposition mechanism changes, suggesting that the heating rate may influence the degradation process.
Figure 5.
The reaction progress vs. temperature for the first decomposition process observed on the DTG curve for A. MUP and B. MTZ.
Figure 5.
The reaction progress vs. temperature for the first decomposition process observed on the DTG curve for A. MUP and B. MTZ.


Figure 6.
The reaction rate vs. temperature for the first decomposition process observed on the DTG curve for A. MUP and B. MTZ.
Figure 6.
The reaction rate vs. temperature for the first decomposition process observed on the DTG curve for A. MUP and B. MTZ.

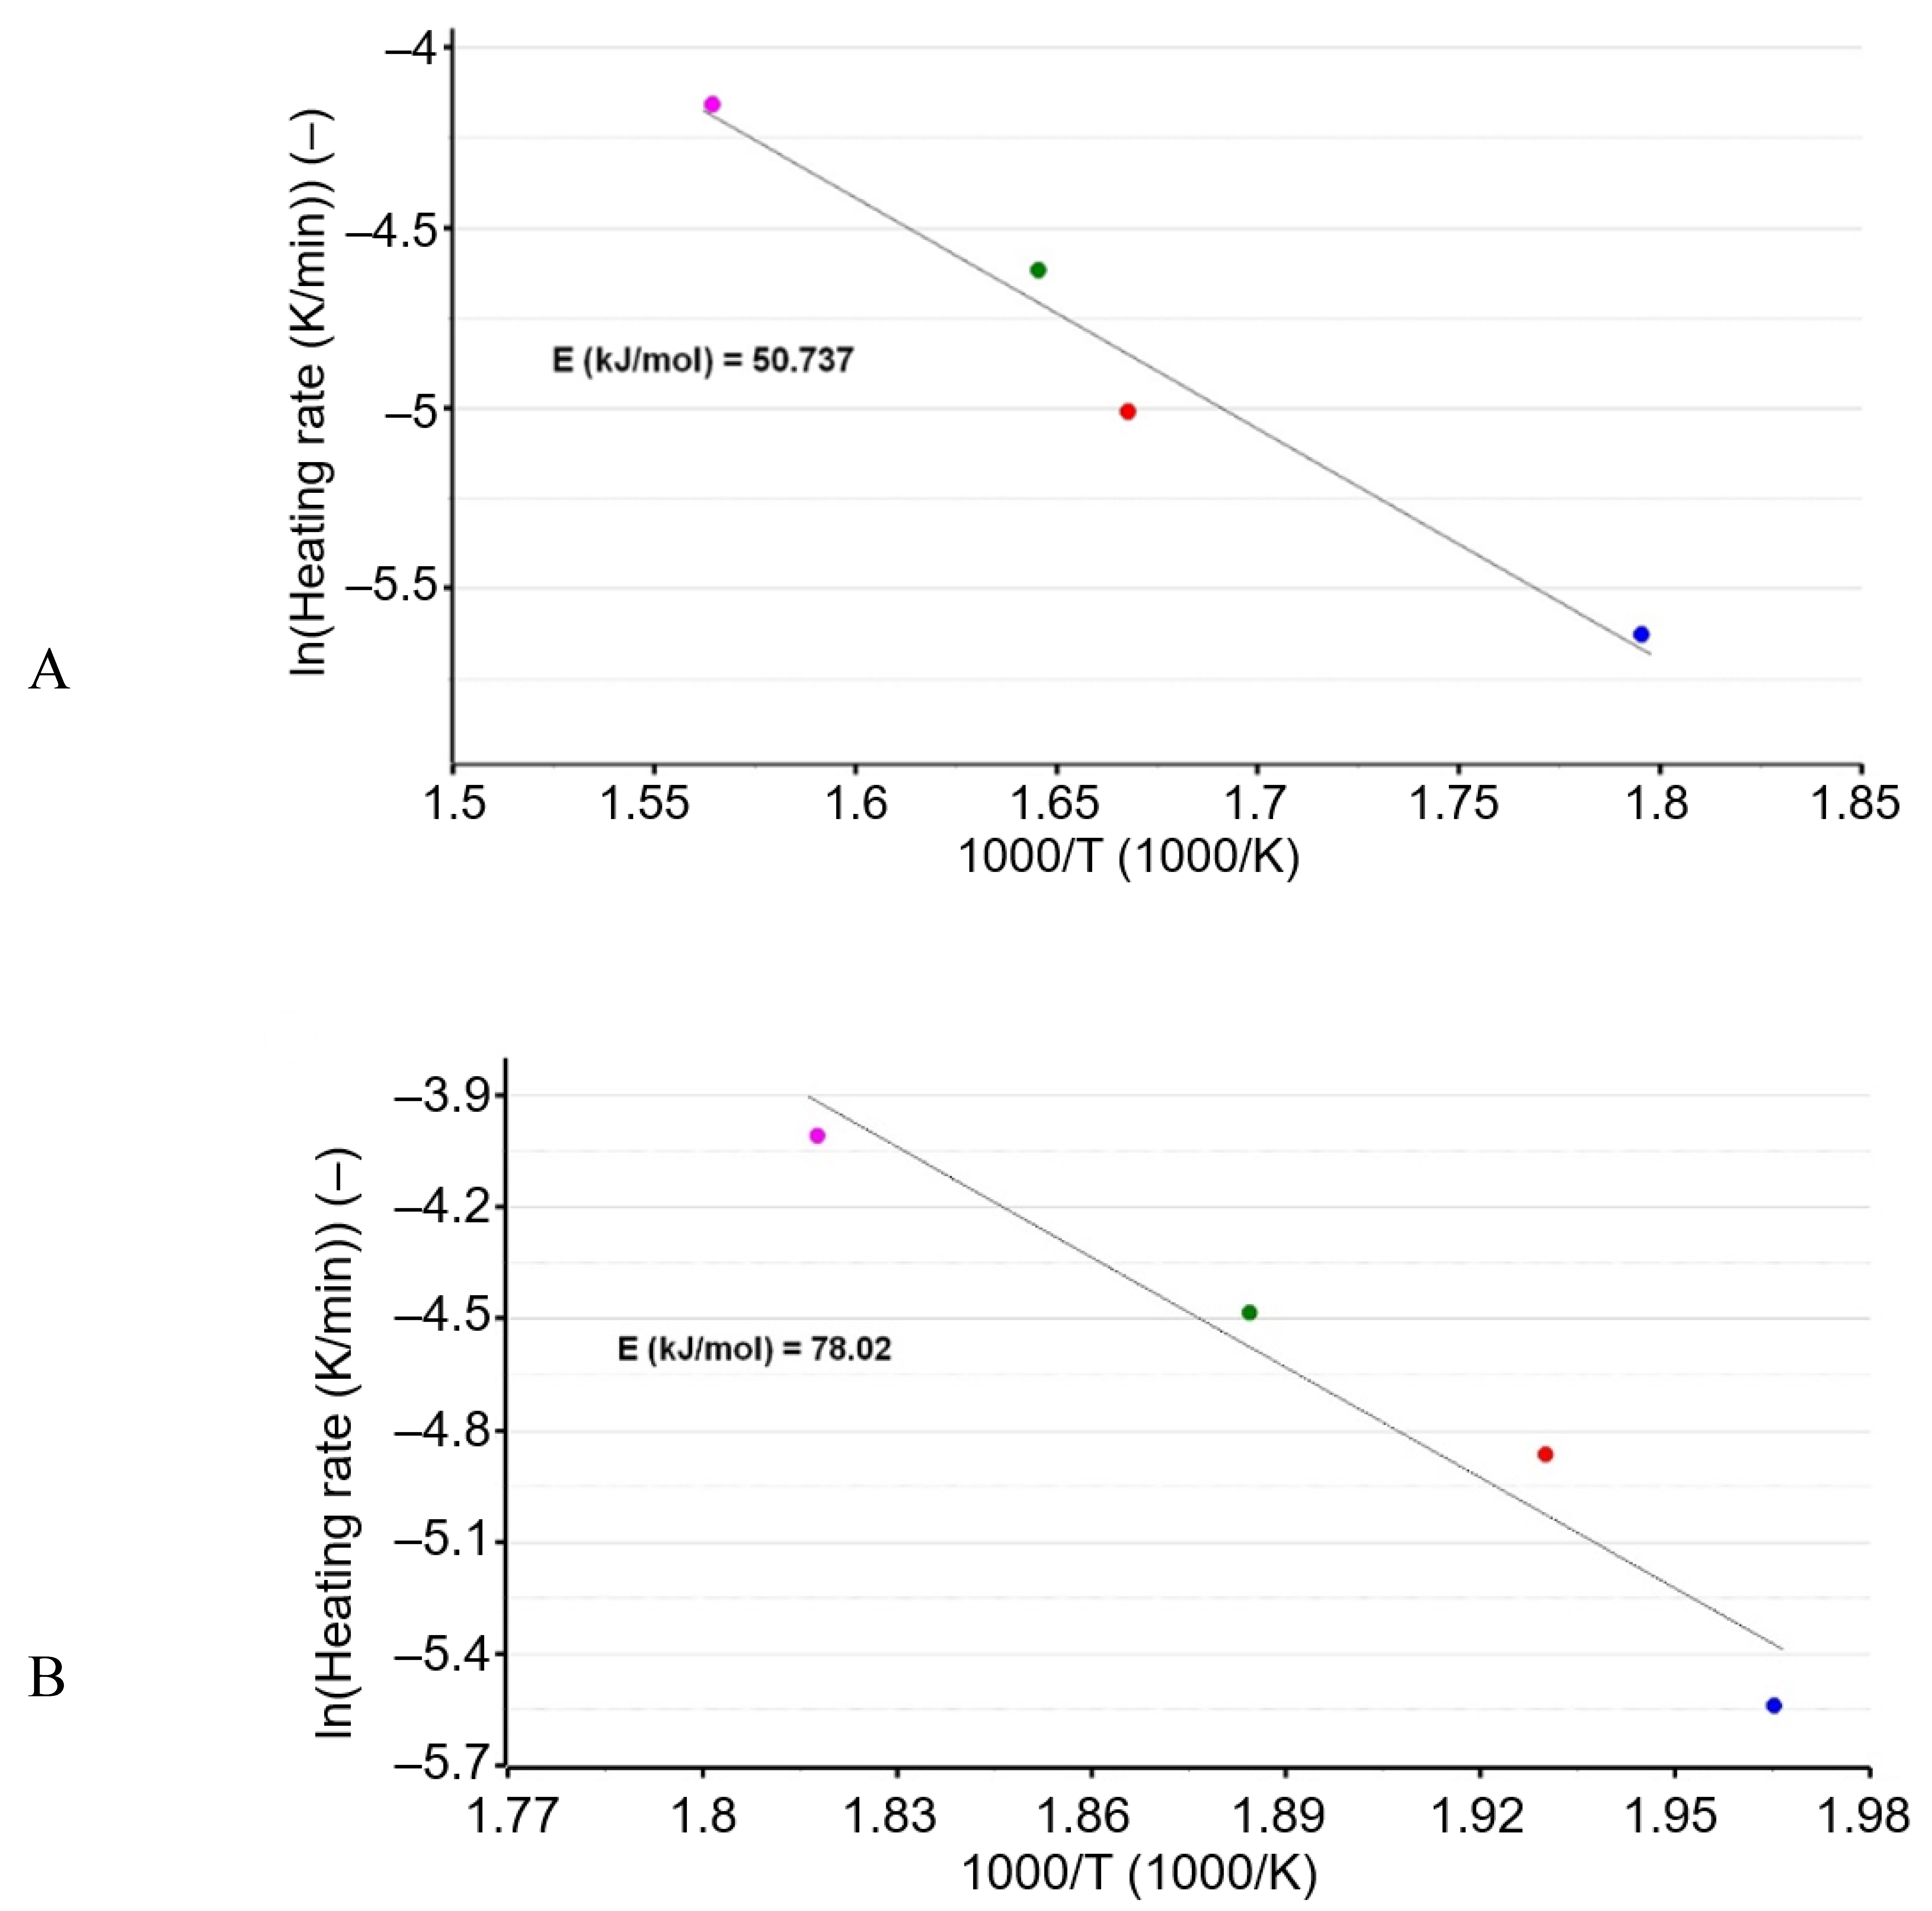
Initially, the ASTM E698 method was employed to calculate the apparent activation energy, and the results obtained are presented in Figure 7. This kinetic method is a non-isoconversional one, where in the calculus of the apparent activation energy (Ea) the data from the reaction progress are not used. Usually, this kinetic method is more suitable for processes consisting of a one-step degradation [27]. The mathematical equation is as follows:
In the case of mupirocin, the lower activation energy (50.737) can be explained by the epoxide moiety, which has a low stability. For metronidazole, the activation energy is equal to 78.02.
Figure 7.
The apparent activation energy calculated for A. MUP and B. MTZ.
To obtain a more in-depth characterization of the degradation processes that take place during the first degradation process, the next step of the kinetic analysis was to calculate the apparent activation energy by using two isoconversional methods, namely the integral Flynn–Wall–Ozawa (FWO) and the differential Friedman method (FR).
The FWO method is an integral isoconversional method which uses Doyle linear approximation to determine the value of the apparent activation energy, making it more suitable for the complex decomposition processes [28]. It is described by the following mathematical equation:
The FR is a differential isoconversional kinetic method which presents the advantage of not using any approximations in the calculation of the apparent activation energy. Also, the value of Ea is calculated at a constant value of α, making it more suitable for non-isothermal processes [28]. The equation used to determine the value of the activation energy is as follows:
The results of the employment of the two isoconversional methods for mupirocin are presented in Figure 8 and Table 4. Also, in Figure 9A, the dependence of lnβ vs. (1/T) is presented in order to obtain the FWO linear dependencies, and in Figure 9B ln(β) vs. (1/T) is presented to acquire the FR linear dependencies.
Figure 8.
Variation in Ea vs. α according to the FWO (A) and FR (B) isoconversional methods of the first decomposition process for MUP.
Figure 8.
Variation in Ea vs. α according to the FWO (A) and FR (B) isoconversional methods of the first decomposition process for MUP.

Table 4.
Variation in Ea vs. α according to the FWO and FR isoconversional methods of the first decomposition process for MUP.
Table 4.
Variation in Ea vs. α according to the FWO and FR isoconversional methods of the first decomposition process for MUP.
| α % | Kinetic Method | |
|---|---|---|
| Fr | FWO | |
| 5 | 28.0 | 43.8 |
| 10 | 24.8 | 40.4 |
| 15 | 29.7 | 39.1 |
| 20 | 37.1 | 39.3 |
| 25 | 44.0 | 40.2 |
| 30 | 50.1 | 41.5 |
| 35 | 54.9 | 43.0 |
| 40 | 59.2 | 44.6 |
| 45 | 63.7 | 46.3 |
| 50 | 66.1 | 48.0 |
| 55 | 68.6 | 49.8 |
| 60 | 71.2 | 51.5 |
| 65 | 73.0 | 53.3 |
| 70 | 76.1 | 55.1 |
| 75 | 78.3 | 57.1 |
| 80 | 79.2 | 59.1 |
| 85 | 74.4 | 60.9 |
| 90 | 64.8 | 62.2 |
| 95 | 59.3 | 62.8 |
| / kJ mol−1 | 58.0 ± 4.1 | 49.4 ± 1.9 |
Figure 9.
Linear plotting of the FWO method (A) and linear plotting of the FR method (B) for MUP.


By analyzing the values of the Ea, the complexity of the decomposition process can be obtained. The FWO kinetic method revealed that at the beginning and at the end of the degradation process, the obtained values of the activation energy were outside the range of 0.9· ≤ Ea (α) ≤1.1·, (α < 35% and α > 70%); meanwhile, the values for Ea calculated for α between 40% and 70%, may suggest that the decomposition process consists of a complex degradation of the active pharmaceutical ingredient. In the case of the FR kinetic method, the same tendency cannot be observed, with the values of Ea being mostly outside the confidence interval (α < 30% and 50% < α < 90%). These results are to be expected, due to the different methods of calculus of the activation energy, with FR being a differential method which does not use any approximations, while FWO is an integral method which uses approximations. The results of the kinetic analysis of MUP suggest that the degradation of the active substance is a complex process.
For metronidazole, the results of the two isoconversional kinetic methods are shown in Figure 10 and Table 5, along with the representation of the FWO linear dependencies lnβ vs. (1/T) (Figure 11A) and the representation of the FR linear dependencies ln(β) vs. (1/T) (Figure 11B).
Figure 10.
Variation in Ea vs. α according to the FWO (A) and FR (B) isoconversional methods of the degradation process for MTZ.
Figure 10.
Variation in Ea vs. α according to the FWO (A) and FR (B) isoconversional methods of the degradation process for MTZ.

Table 5.
Variation in Ea vs. α according to the FWO and FR isoconversional methods of the degradation process for MTZ.
Table 5.
Variation in Ea vs. α according to the FWO and FR isoconversional methods of the degradation process for MTZ.
| α % | Kinetic Method | |
|---|---|---|
| Fr | FWO | |
| 5 | 50.5 | 76.3 |
| 10 | 56.9 | 70.5 |
| 15 | 62.0 | 69.3 |
| 20 | 64.9 | 69.2 |
| 25 | 67.0 | 69.5 |
| 30 | 68.0 | 69.9 |
| 35 | 69.1 | 70.3 |
| 40 | 70.0 | 70.7 |
| 45 | 70.9 | 71.2 |
| 50 | 71.8 | 71.6 |
| 55 | 73.0 | 72.0 |
| 60 | 74.3 | 72.5 |
| 65 | 75.7 | 73.0 |
| 70 | 77.3 | 73.6 |
| 75 | 78.5 | 74.1 |
| 80 | 78.5 | 74.7 |
| 85 | 76.4 | 75.1 |
| 90 | 69.6 | 75.3 |
| 95 | 50.9 | 74.8 |
| / kJ mol−1 | 68.7 ± 1.9 | 72.3 ± 0.5 |
Figure 11.
Linear plotting of the FWO method (A) and linear plotting of the FR method (B) for MTZ.


The results of the FWO isoconversional kinetic method showed that all the values of the Ea were in the range of the confidence interval, suggesting that the degradation of metronidazole is a one-step process. The results of the FR isoconversional method show that the values of the activation energy corresponding to the α equal to 5, 10, 70, 75, 80, 85 and 95% are outside the confidence interval of 0.9· ≤ Ea (α) ≤1.1·. Those results are due to the different calculation methods used by the FR method. Thus, the results of the two isoconversional methods suggest that the degradation of metronidazole is a one-step process.
Conclusions
The purpose of this study was to fully characterize and understand the degradation processes of mupirocin and metronidazole, and to study whether there are any chemical interactions between the two compounds.
Initially, the FTIR investigations were conducted to confirm the identity of the pure active pharmaceutical ingredients (mupirocin and metronidazole) and to determine if there were any chemical interactions between the two compounds at ambient temperature. The results showed the lack of a chemical interaction between the two compounds at ambient temperature.
The thermal investigations (TG and DTG) revealed that mupirocin is thermally stable up to 148 °C and its degradation process takes place in four steps. In the case of metronidazole, it presents a thermal stability up to 135 °C, and a degradation process consisting of one step. When heated, the existence of a chemical interaction between the two active pharmaceutical ingredients is observed. Due to the lack of chemical interactions between mupirocin and metronidazole at ambient temperature and the fact that the chemical interaction, when heated, is observed only at 298 °C, it can be concluded that a new pharmaceutical formulation containing both compounds is possible, increasing the compliance of the patient to the treatment.
The kinetic analysis was performed for the first degradation process observed on the DTG curves registered at β = 2, 4, 6 and 10 °C·min−1 for mupirocin and metronidazole, and the following kinetic methods were applied: ASTM E698, Flynn–Wall–Ozawa and Friedman. The degradation of mupirocin consists of a complex decomposition process, while for metronidazole the degradation takes place in one step.
As a further perspective of this study, we aim to determine the antibacterial effect of the mixture on MRSA, as well as studying the compatibility of the mixture with several pharmaceutical excipients.
Author Contributions
Conceptualization, A.R., A.L. and I.L.; methodology, A.R., A.L. and I.L.; software, A.R., D.I., C.T. and L.S.; validation, L.-M.Ș., R.B., A.D. and F.C.; formal analysis, D.I., L.S., A.D. and F.C.; investigation, A.R., A.L. and I.L.; resources, A.L. and I.L.; data curation, A.R. and A.L.; writing—original draft preparation, A.R., A.L., F.C. and I.L.; writing—review and editing, A.R., A.L., F.C. and I.L.; visualization, F.C.; supervision, I.L.; funding acquisition, A.L. and I.L. All authors have read and agreed to the published version of the manuscript.
Funding
This research received no external funding.
Conflicts of Interest
The authors declare no conflicts of interest.
References
- Thomas, C.M.; Hothersall, J.; Willis, C.L.; Simpson, T.J. Resistance to and synthesis of the antibiotic mupirocin. Nat. Rev. Microbiol. 2010, 8, 281–289. [Google Scholar] [CrossRef] [PubMed]
- Fritz, E.; Fekete, A.; Lintelmann, J.; Schmitt-Kopplin, P.; Meckenstock, R.U. Isolation of two Pseudomonas strains producing pseudomonic acid A. Syst. Appl. Microbiol. 2009, 32, 56–64. [Google Scholar] [CrossRef]
- Fuller, A.T.; Mellows, G.; Woolford, M.; Banks, G.T.; Barrow, K.D.; Chain, E.B. Pseudomonic Acid: An Antibiotic produced by Pseudomonas fluorescens. Nature 1971, 234, 416–417. [Google Scholar] [CrossRef]
- Stierle, D.B.; Stierle, A.A. Pseudomonic acid derivatives from a marine bacterium. Experientia 1992, 48, 1165–1169. [Google Scholar] [CrossRef]
- Tucaliuc, A.; Blaga, A.C.; Galaction, A.I.; Cascaval, D. Mupirocin: Applications and production. Biotechnol. Lett. 2019, 41, 495–502. [Google Scholar] [CrossRef] [PubMed]
- Alexander, R.G.; Clayton, J.P.; Luk, K.; Rogers, N.H.; King, T.J. The chemistry of pseudomonic acid. Part 1. The absolute configuration of pseudomonic acid A. J. Chem. Soc. Perkin Trans. 1 1978, 6, 561–565. [Google Scholar] [CrossRef]
- WHO. Publishes List of Bacteria for Which New Antibiotics Are Urgently Needed. Available online: https://www.who.int/news/item/27-02-2017-who-publishes-list-of-bacteria-for-which-new-antibiotics-are-urgently-needed (accessed on 19 December 2023).
- Romanescu, M.; Oprean, C.; Lombrea, A.; Badescu, B.; Teodor, A.; Constantin, G.D.; Andor, M.; Folescu, R.; Muntean, D.; Danciu, C.; et al. Current State of Knowledge Regarding WHO High Priority Pathogens—Resistance Mechanisms and Proposed Solutions through Candidates Such as Essential Oils: A Systematic Review. Int. J. Mol. Sci. 2023, 24, 9727. [Google Scholar] [CrossRef] [PubMed]
- Gangwar, A.; Kumar, P.; Singh, R.; Kush, P. Recent Advances in Mupirocin Delivery Strategies for the Treatment of Bacterial Skin and Soft Tissue Infection. Future Pharmacol. 2021, 1, 80–103. [Google Scholar] [CrossRef]
- Cern, A.; Connolly, K.L.; Jerse, A.E.; Barenholz, Y. In vitro susceptibility of neisseria gonorrhoeae strains to mupirocin, an antibiotic reformulated for parenteral administration in nanoliposomes. Antimicrob. Agents Chemother. 2018, 62, e02377–17. [Google Scholar] [CrossRef]
- Williamson, D.A.; Carter, G.P.; Howden, B.P. Current and Emerging Topical Antibacterials and Antiseptics: Agents, Action, and Resistance Patterns. Clin. Microbiol. Rev. 2017, 30, 827–860. [Google Scholar] [CrossRef]
- Rumsfield, J.; West, D.P.; Aronson, I.K. Topical Mupirocin in the Treatment of Bacterial Skin Infections. Drug Intell. Clin. Pharm. 1986, 20, 943–948. [Google Scholar] [CrossRef]
- Dadashi, M.; Hajikhani, B.; Darban-Sarokhalil, D.; van Belkum, A.; Goudarzi, M. Mupirocin resistance in Staphylococcus aureus: A systematic review and meta-analysis. J. Glob. Antimicrob. Resist. 2020, 20, 238–247. [Google Scholar] [CrossRef]
- Zheng, S.; Chung, S.J.; Sim, H.C.J.; Chlebicka, T.M.; Chan, Y.H.; Lim, T.P.; Kwa, L.H.A.; Chlebicki, M.P. Impact of formulary interventions on the minimum inhibitory concentration of methicillin-resistant Staphylococcus aureus to mupirocin, chlorhexidine, and octenidine in a Singapore tertiary institution. Eur. J. Clin. Microbiol. Infect. Dis. 2020, 39, 2397–403. [Google Scholar] [CrossRef]
- Miller, L.G.; Singh, R.; Eells, S.J.; Gillen, D.; McKinnell, J.A.; Park, S.; Tjoa, T.; Chang, J.; Rashid, S.; Macias-Gil, R.; et al. Chlorhexidine and Mupirocin for Clearance of Methicillin-Resistant Staphylococcus aureus Colonization After Hospital Discharge: A Secondary Analysis of the Changing Lives by Eradicating Antibiotic Resistance Trial. Clin. Infect. Dis. 2023, 76, e1208–e1216. [Google Scholar] [CrossRef]
- Lepelletier, D.; Maillard, J.Y.; Pozzetto, B.; Simon, A. Povidone Iodine: Properties, Mechanisms of Action, and Role in Infection Control and Staphylococcus aureus Decolonization. Antimicrob. Agents Chemother. 2020, 64. [Google Scholar] [CrossRef] [PubMed]
- Caussa, J.E.; Luis, J.; Bernal, R. Clinical Assessment of Specifically Formulated Creams for Oncology: Case Series. Preprints 2023. ahead of print. [Google Scholar] [CrossRef]
- Nandimath, S.A.; Chickklingaiah, R.G.; Nandimath, V.A.; Godse, A.M.; Mishra, B.; Priya, S. Healer granules in nonhealing infected wounds. Ann. Maxillofac. Surg. 2018, 8, 224–229. [Google Scholar] [CrossRef]
- Thakur, R.A.; Florek, C.A.; Kohn, J.; Michniak, B.B. Electrospun nanofibrous polymeric scaffold with targeted drug release profiles for potential application as wound dressing. Int. J. Pharm. 2008, 364, 87–93. [Google Scholar] [CrossRef]
- Singh, A.; Kuzhikkali, V.; Haq, M. Irritant Contact Dermatitis With Topical Povidone-Iodine Ointment Post Ear Surgery. Ear Nose Throat J. 2021, 100, NP139–NP140. [Google Scholar] [CrossRef]
- Xie, D.-L.; Nguyen, T.H.; Norman, R.A. Case 2: Leg Lesion with Clinical Impression: Stasis vs. Skin Cancer. In Clinical Cases in Dermatopathology; Springer International Publishing: Cham, Switzerland, 2020; pp. 7–13. [Google Scholar]
- Leitsch, D. A review on metronidazole: An old warhorse in antimicrobial chemotherapy. Parasitology 2019, 146, 1167–1178. [Google Scholar] [CrossRef]
- FDA, CDER. FLAGYL ® (metronidazole) Capsules; FDA, CDER: Silver Spring, MD, USA, 2021. [Google Scholar]
- Chadha, R.; Bhandari, S. Drug-excipient compatibility screening-Role of thermoanalytical and spectroscopic techniques. J. Pharm. Biomed. Anal. 2014, 87, 82–97. [Google Scholar] [CrossRef] [PubMed]
- Stuart, B.H. Infrared Spectroscopy: Fundamentals and Applications; Wiley: Hoboken, NJ, USA, 2004. [Google Scholar] [CrossRef]
- Silverstein, R.M.; Webster, F.X.; Kiemle, D.J.; Bryce, D.L. Spectrometric Identification of Organic Compounds, 8th ed.; Wiley: New York, NY, USA, 2014. [Google Scholar]
- Osman, A.I.; Fawzy, S.; Farrell, C.; Ala’a, H.; Harrison, J.; Al-Mawali, S.; Rooney, D.W. Comprehensive thermokinetic modelling and predictions of cellulose decomposition in isothermal, non-isothermal, and stepwise heating modes. J. Anal. Appl. Pyrolysis 2022, 161, 105427. [Google Scholar] [CrossRef]
- Khawam, A.; Flanagan, D.R. Role of isoconversional methods in varying activation energies of solid-state kinetics: II. Nonisothermal kinetic studies. Thermochim. Acta 2005, 436, 101–112. [Google Scholar] [CrossRef]
© 2024 Copyright by the authors. Licensed as an open access article using a CC BY 4.0 license.